My Homelab Draws Its Own Map
Tags:#homelabUpdated
Update, November 6: matrim now hosts stedding sandboxes, Raken is retired, and Lan does the agents’ work. The homelab page has the current setup.
The README for my homelab repo still has the topology diagram I put together in August. It’s a nice diagram. It also shows five services that don’t exist anymore (a dev VM, Hindsight, Tracefinity, Frigate and Dozzle) and is missing the Home Assistant VM I added in September. I never updated it.
The fix was to stop drawing it. The dashboard at infra.half.black now builds the map from the same files I already keep up to date because the machines depend on them.
The repo is the inventory
The homelab is two small Proxmox nodes (think-1 and think-2), a NixOS box called matrim that runs the ADS-B receiver for Raken, a Synology NAS for backups, and a handful of VMs: Caddy for ingress, an apps VM, monitoring, Home Assistant and two AI agents. Tailscale ties it together.
Three files in the repo describe all of it:
infrastructure/hosts.yaml: every machine and VM, its role, which node it runs on, its addresses, what services it runs and which backup job covers it.infrastructure/caddy/Caddyfile: the live Caddy config. I edit it in the repo and copy it to the host, never the other way around.infrastructure/tailnet.yaml: the Tailscale peers, ACL notes and tags, as of the last time I checked.
Each app’s Compose file lives in the repo too, along with a runbook per service. Secrets stay in root-only .env files on the hosts, and the repo only has .env.example files listing the keys.
The map
The Topology view reads those three files at build time. The Caddyfile parser is about 50 lines that walk site blocks, count braces to track nesting and pull out the reverse_proxy upstreams. Quoted strings get blanked before counting, because the 3D printer’s block answers with inline JSON and its braces would throw off the depth. Each upstream gets matched to a host in hosts.yaml by address, and anything that doesn’t match gets flagged instead of silently dropped.
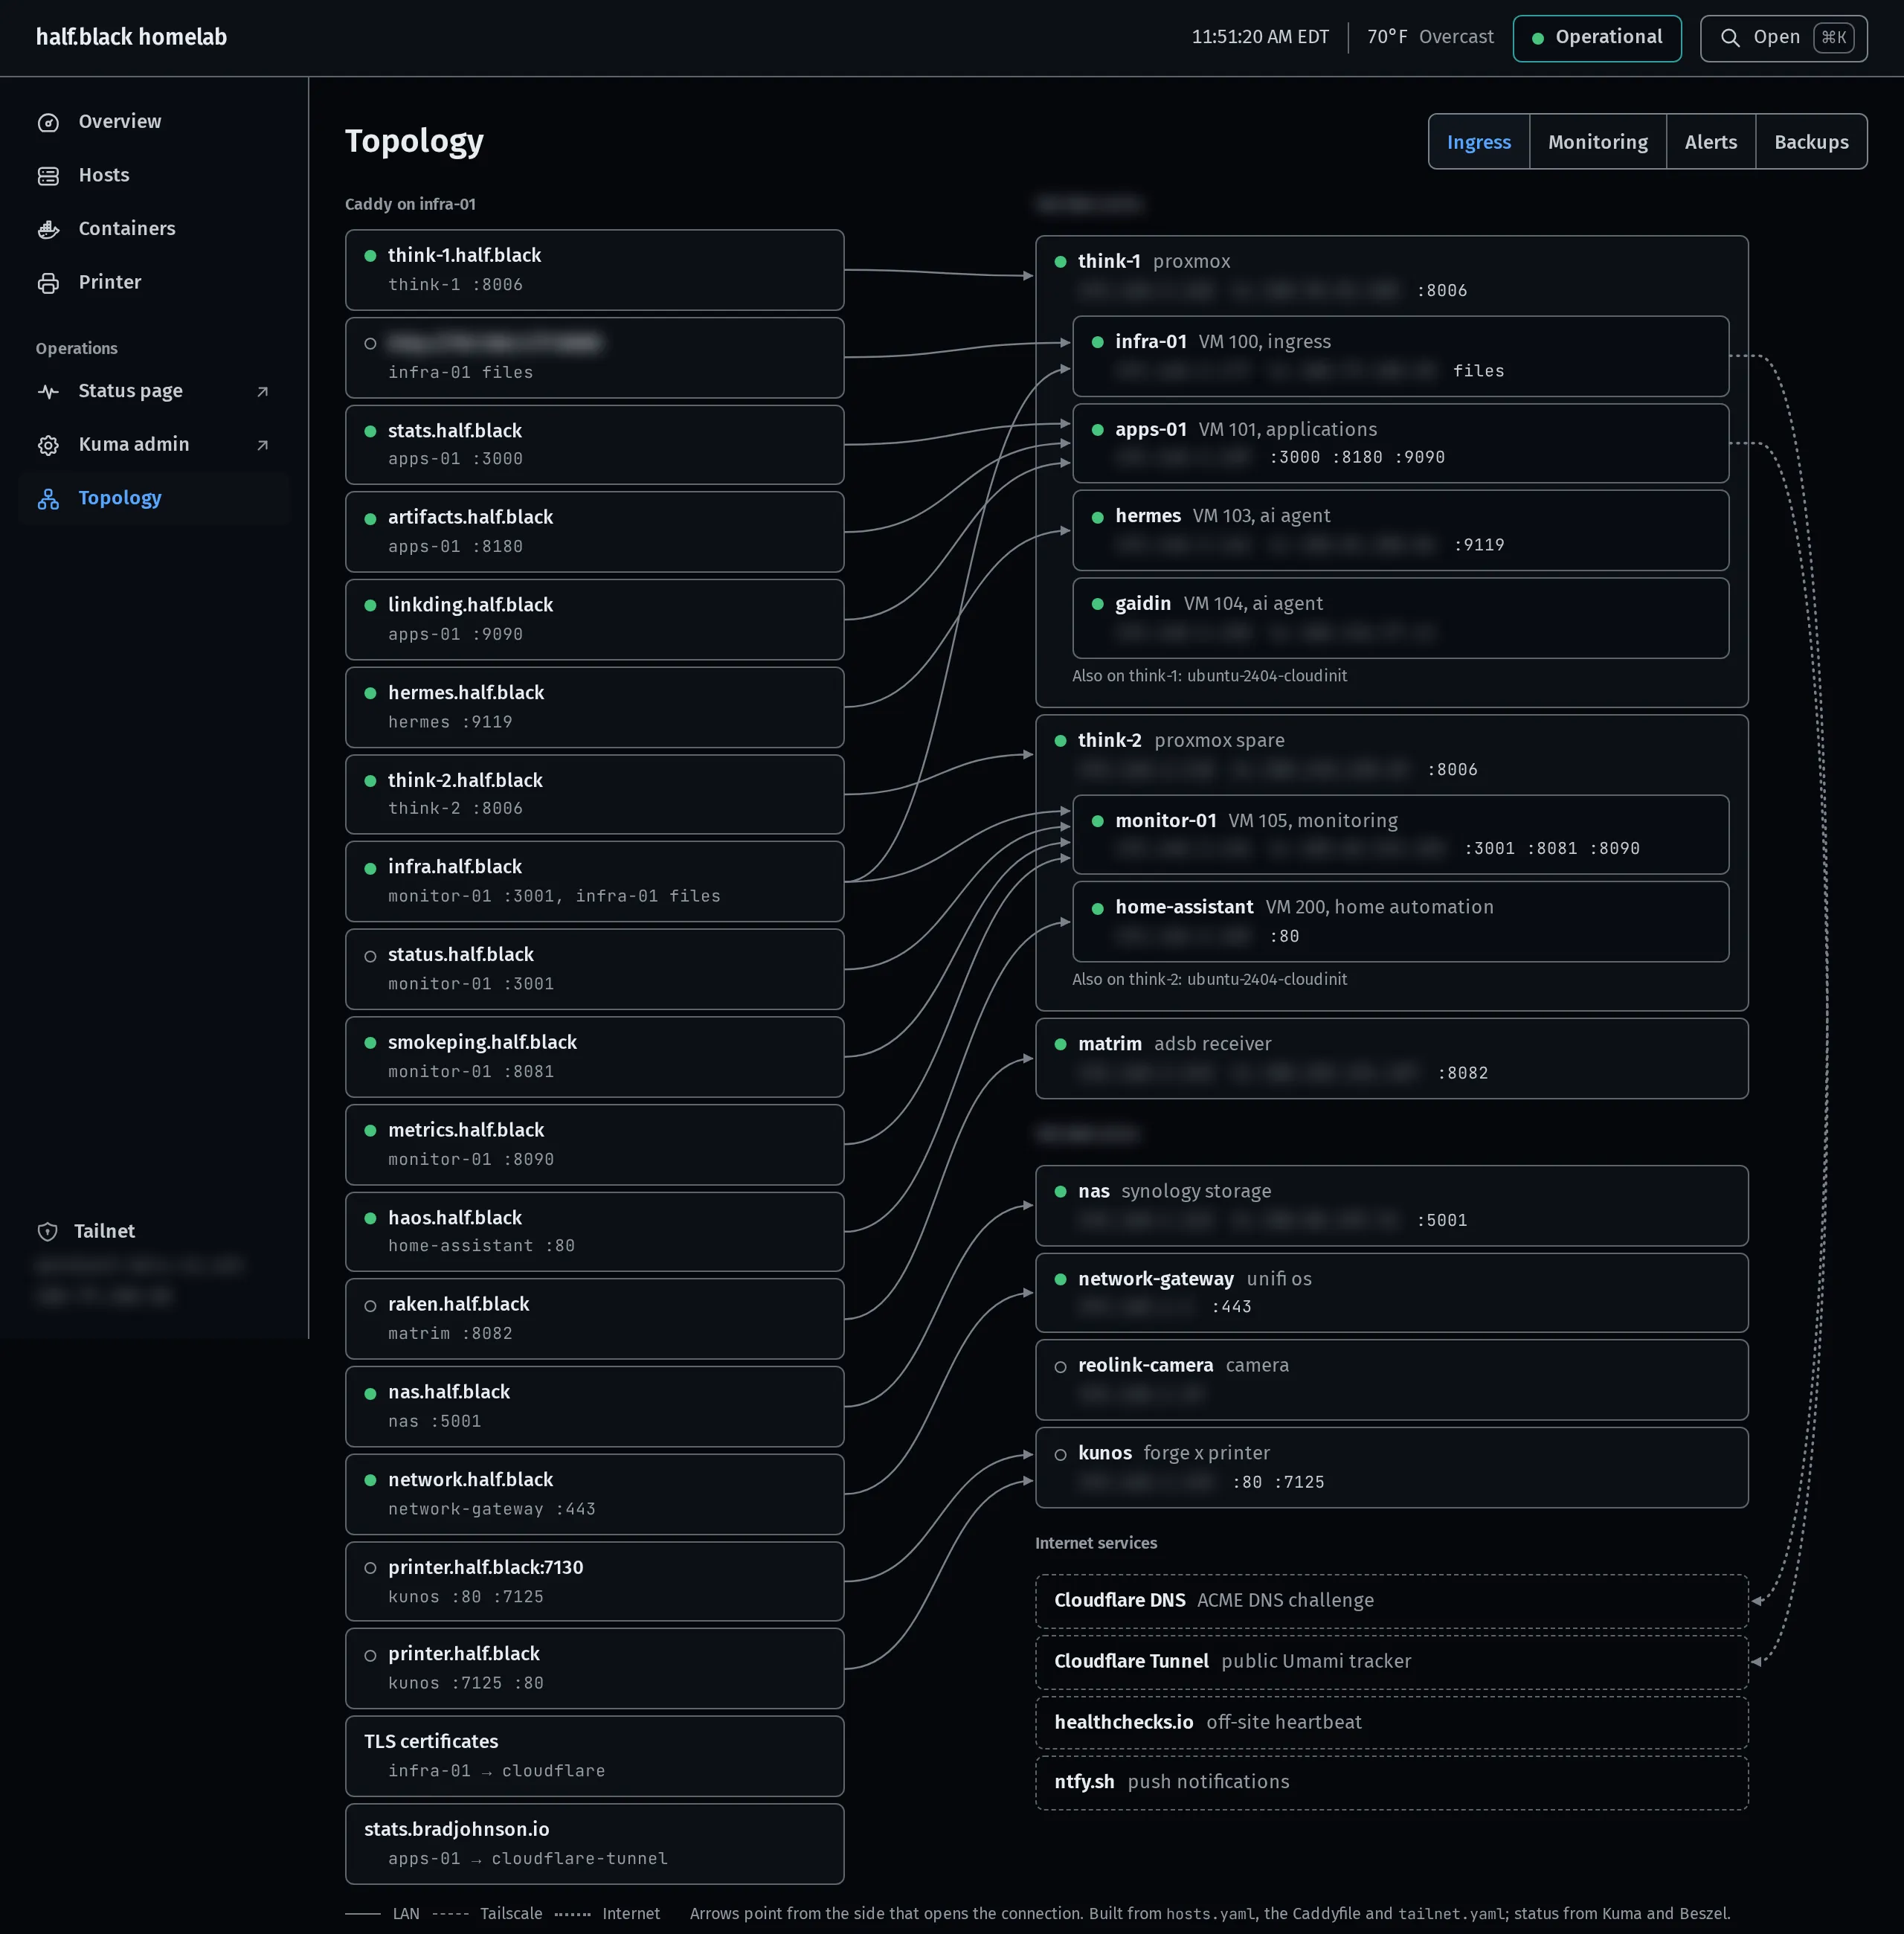
I blurred the IP addresses for this post, but everything else is live. VMs sit inside the node they run on. Arrows point from the side that opens the connection, and the line style says whether it goes over the LAN, Tailscale or the internet. Status dots come from Uptime Kuma and Beszel.
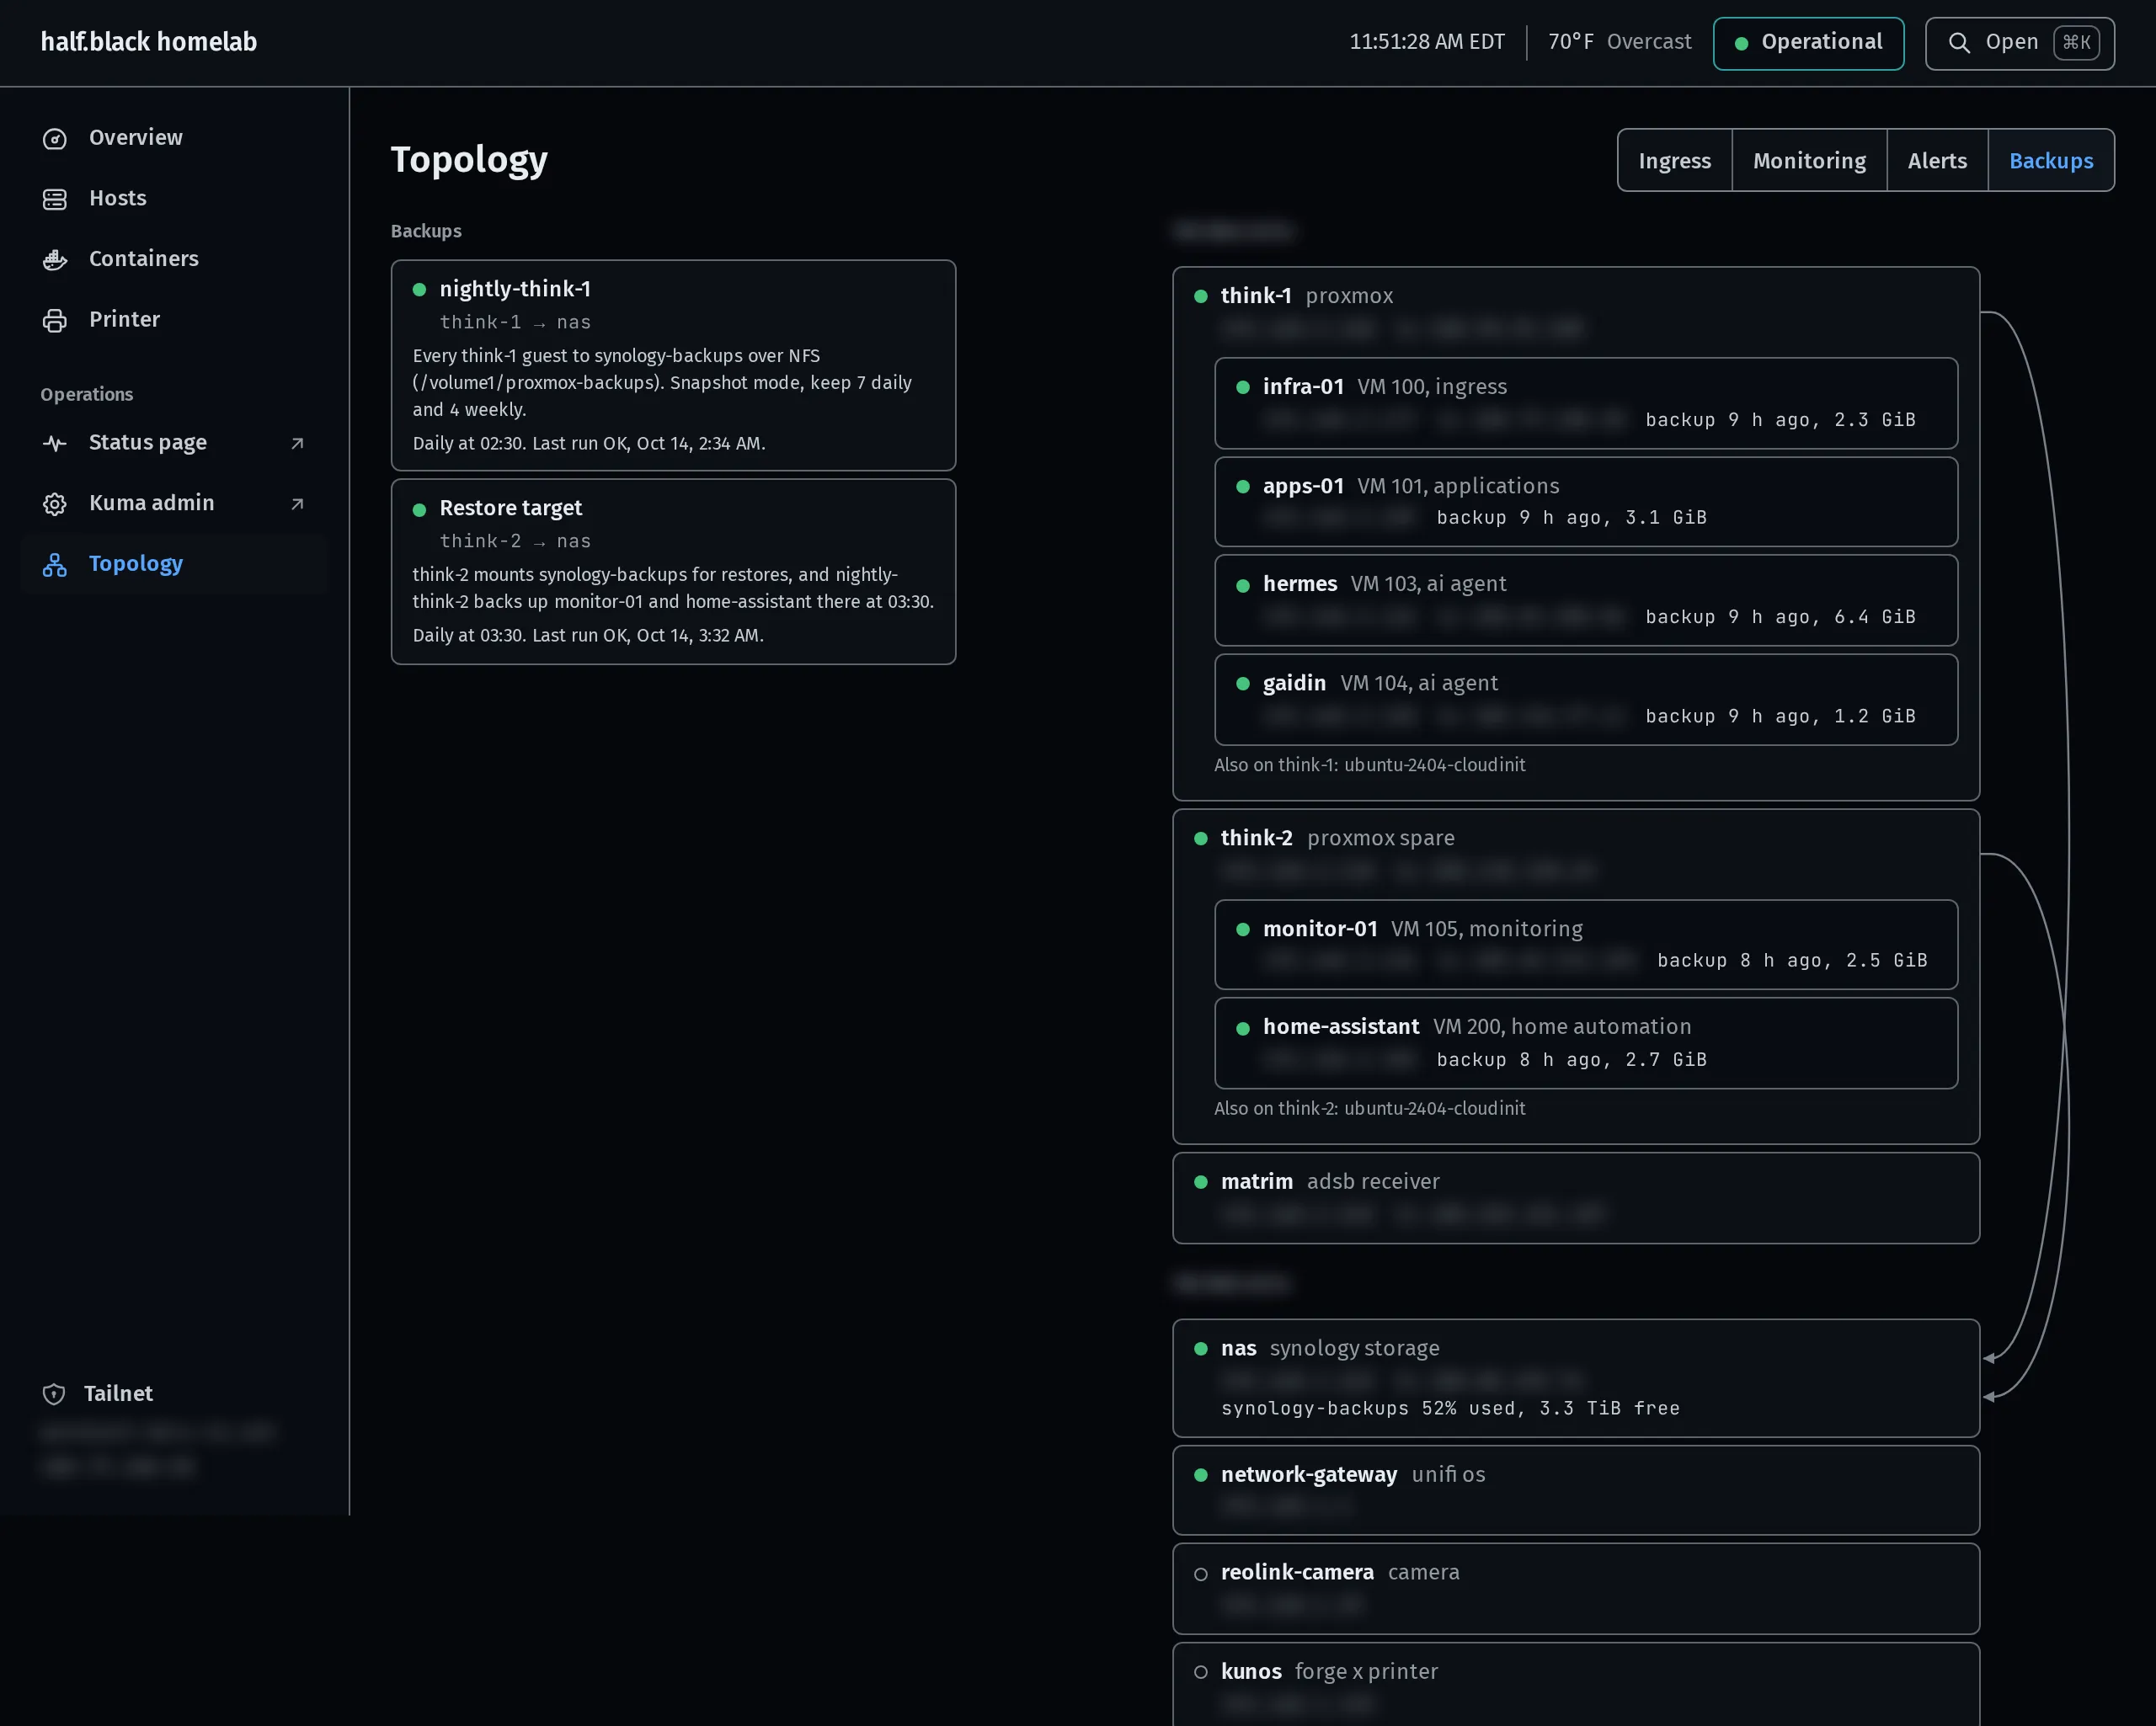
The Ingress layer is fully generated. The Monitoring, Alerts and Backups layers are partly written by hand in src/topology.ts, since “Kuma on monitor-01 checks think-1” isn’t in any config file, and each of those paths has a comment pointing at the runbook it came from. Here’s the Backups layer, with the last backup of every guest pulled from Proxmox:
Getting YAML into the page without shipping a YAML parser to the browser took a tiny Vite plugin:
// Inlines YAML files as JSON at build time, so the inventory ships without a parser.
function yamlPlugin(): Plugin {
  return {
    name: 'homelab-yaml',
    transform(code, id) {
      if (!id.endsWith('.yaml')) return null
      return { code: `export default ${JSON.stringify(parse(code))};`, map: null }
    },
  }
}
The tradeoff is that editing hosts.yaml needs a rebuild and deploy before the dashboard shows it.
Hosts and backups
The Hosts view joins hosts.yaml with a Beszel snapshot, so each machine shows where it lives along with an hour of CPU and memory, disk and temperature. Below that are the two nightly backup jobs, read from Proxmox every 15 minutes.
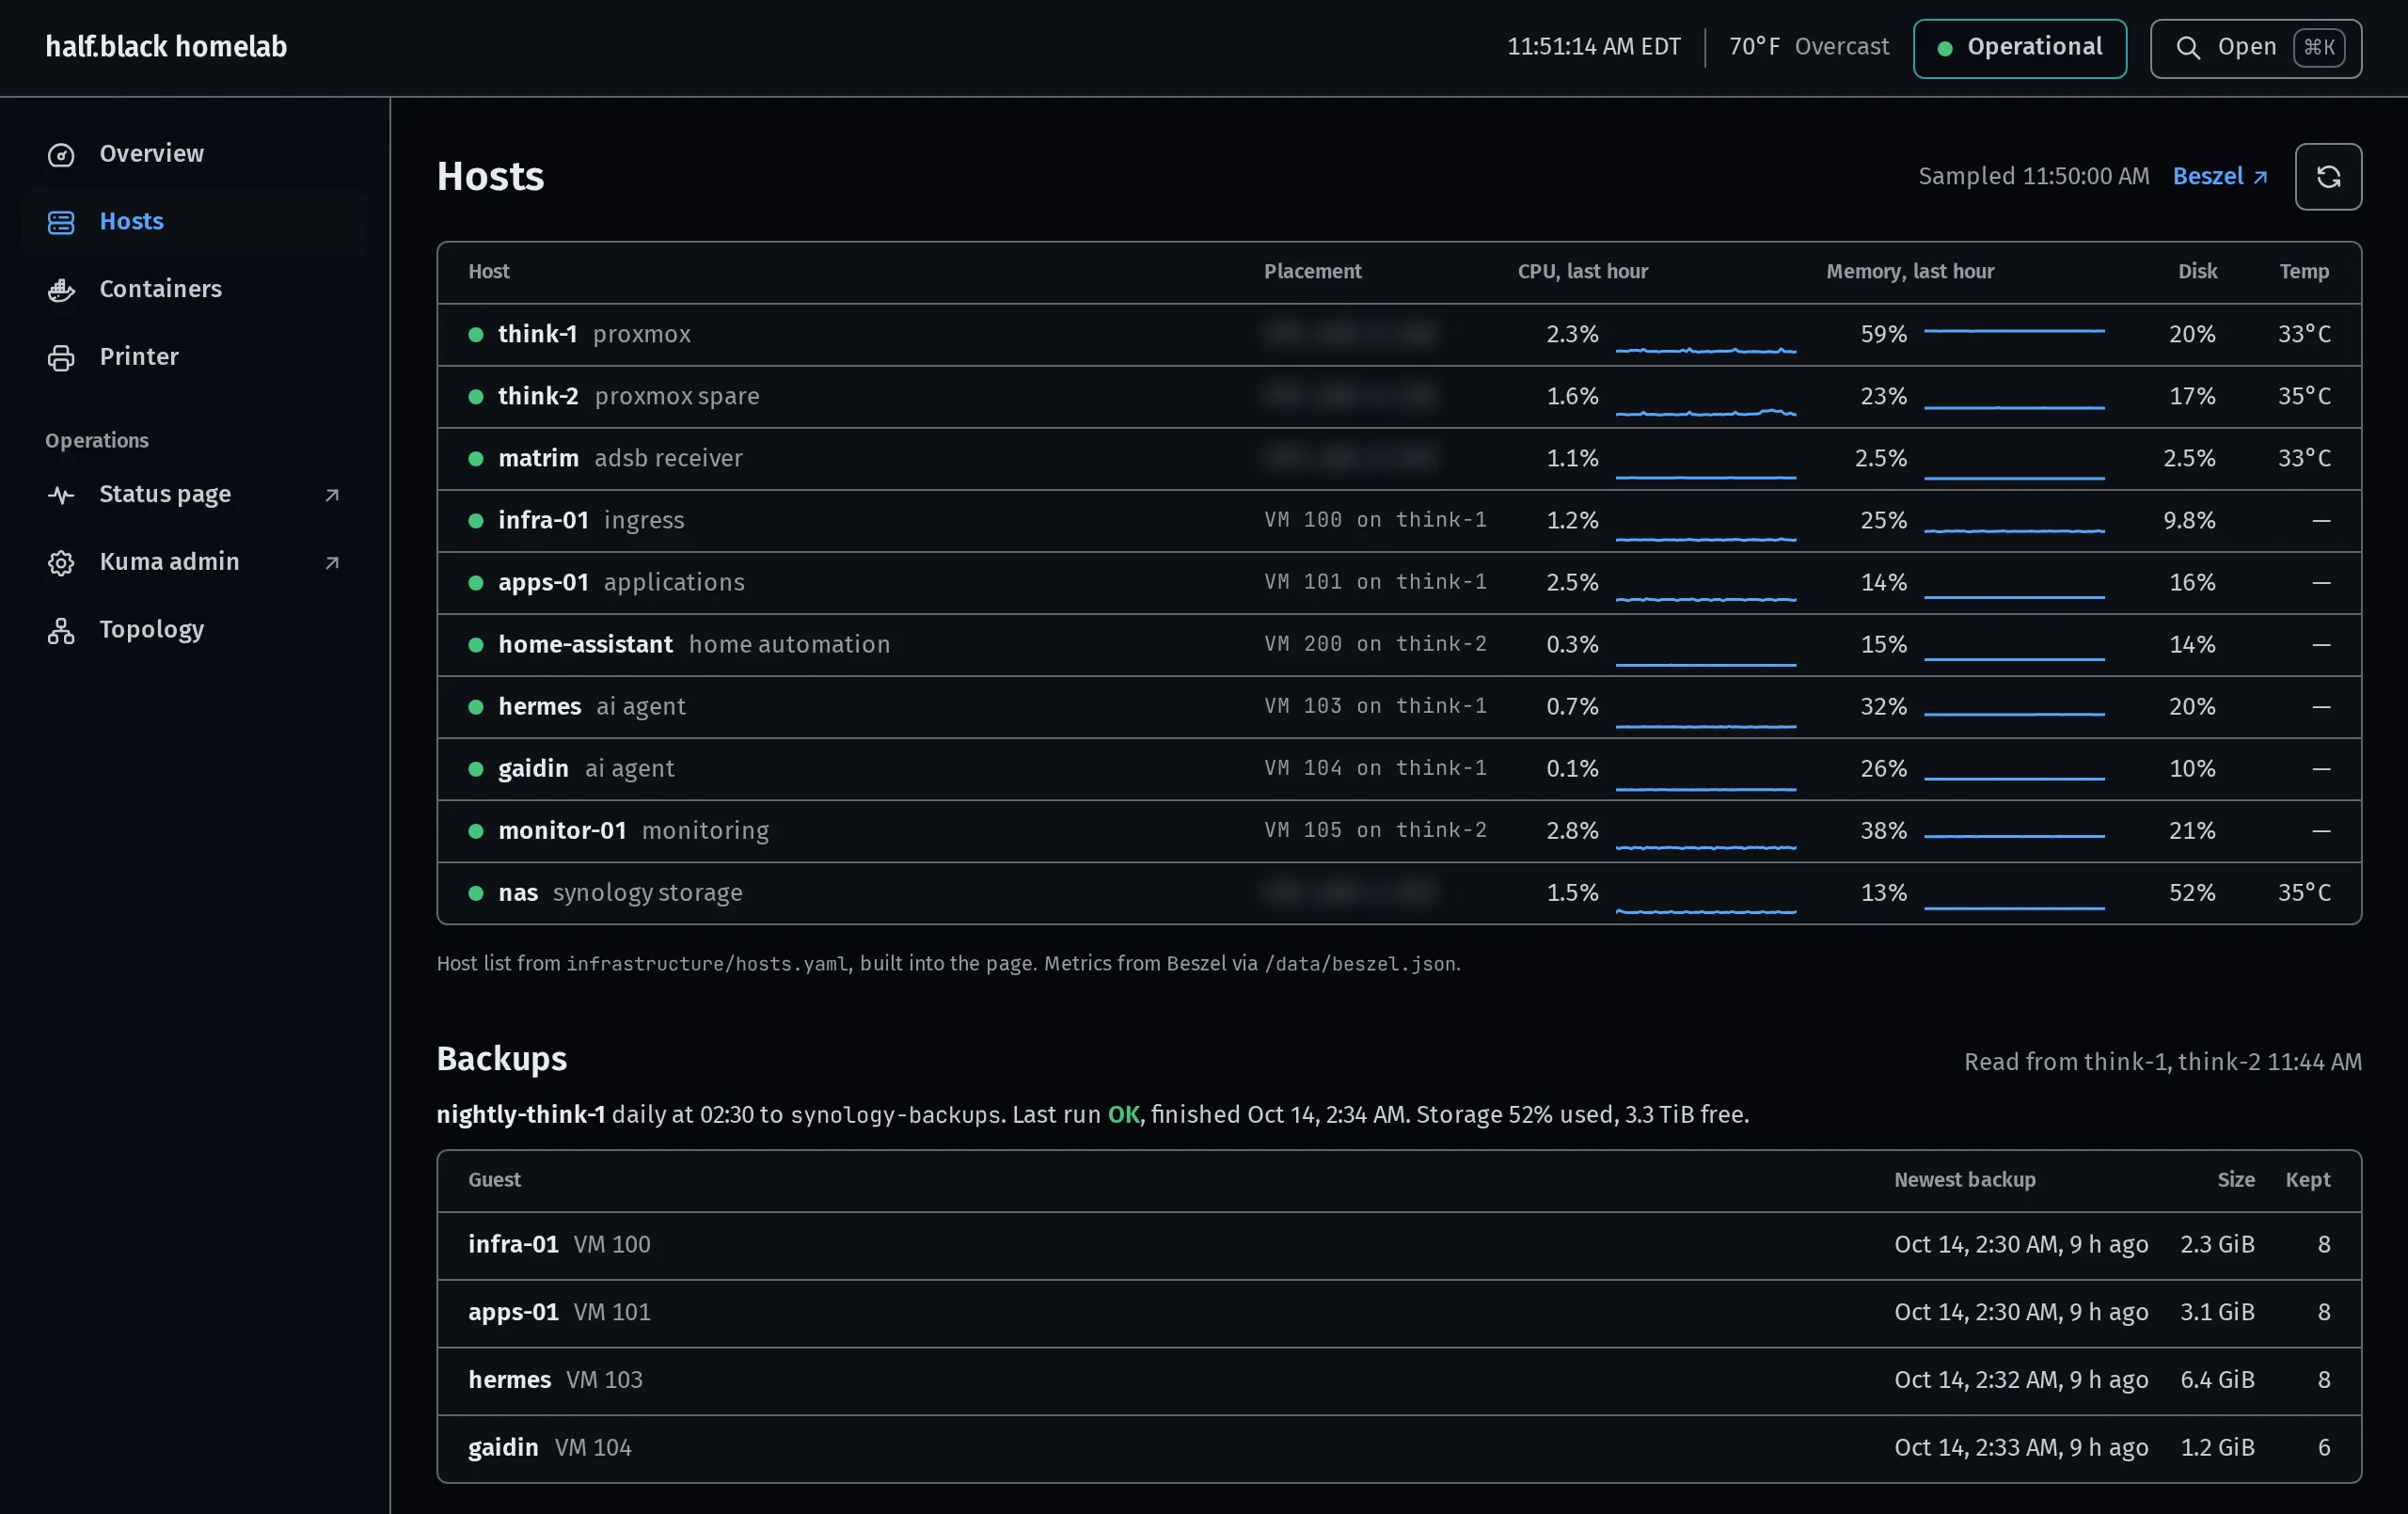
The dashboard is a static React app, so none of this comes from a backend. Systemd timers on the ingress VM collect read-only snapshots of Docker, Beszel and the backups into JSON files, and the page fetches those. The Docker collector connects to each host with a pinned host key, and the Beszel snapshot is redacted before it’s written.
What needs attention
The Overview pulls all four feeds (Kuma, Docker, Beszel, backups) into one line at the top. The day I took these screenshots, it said nothing needed attention:
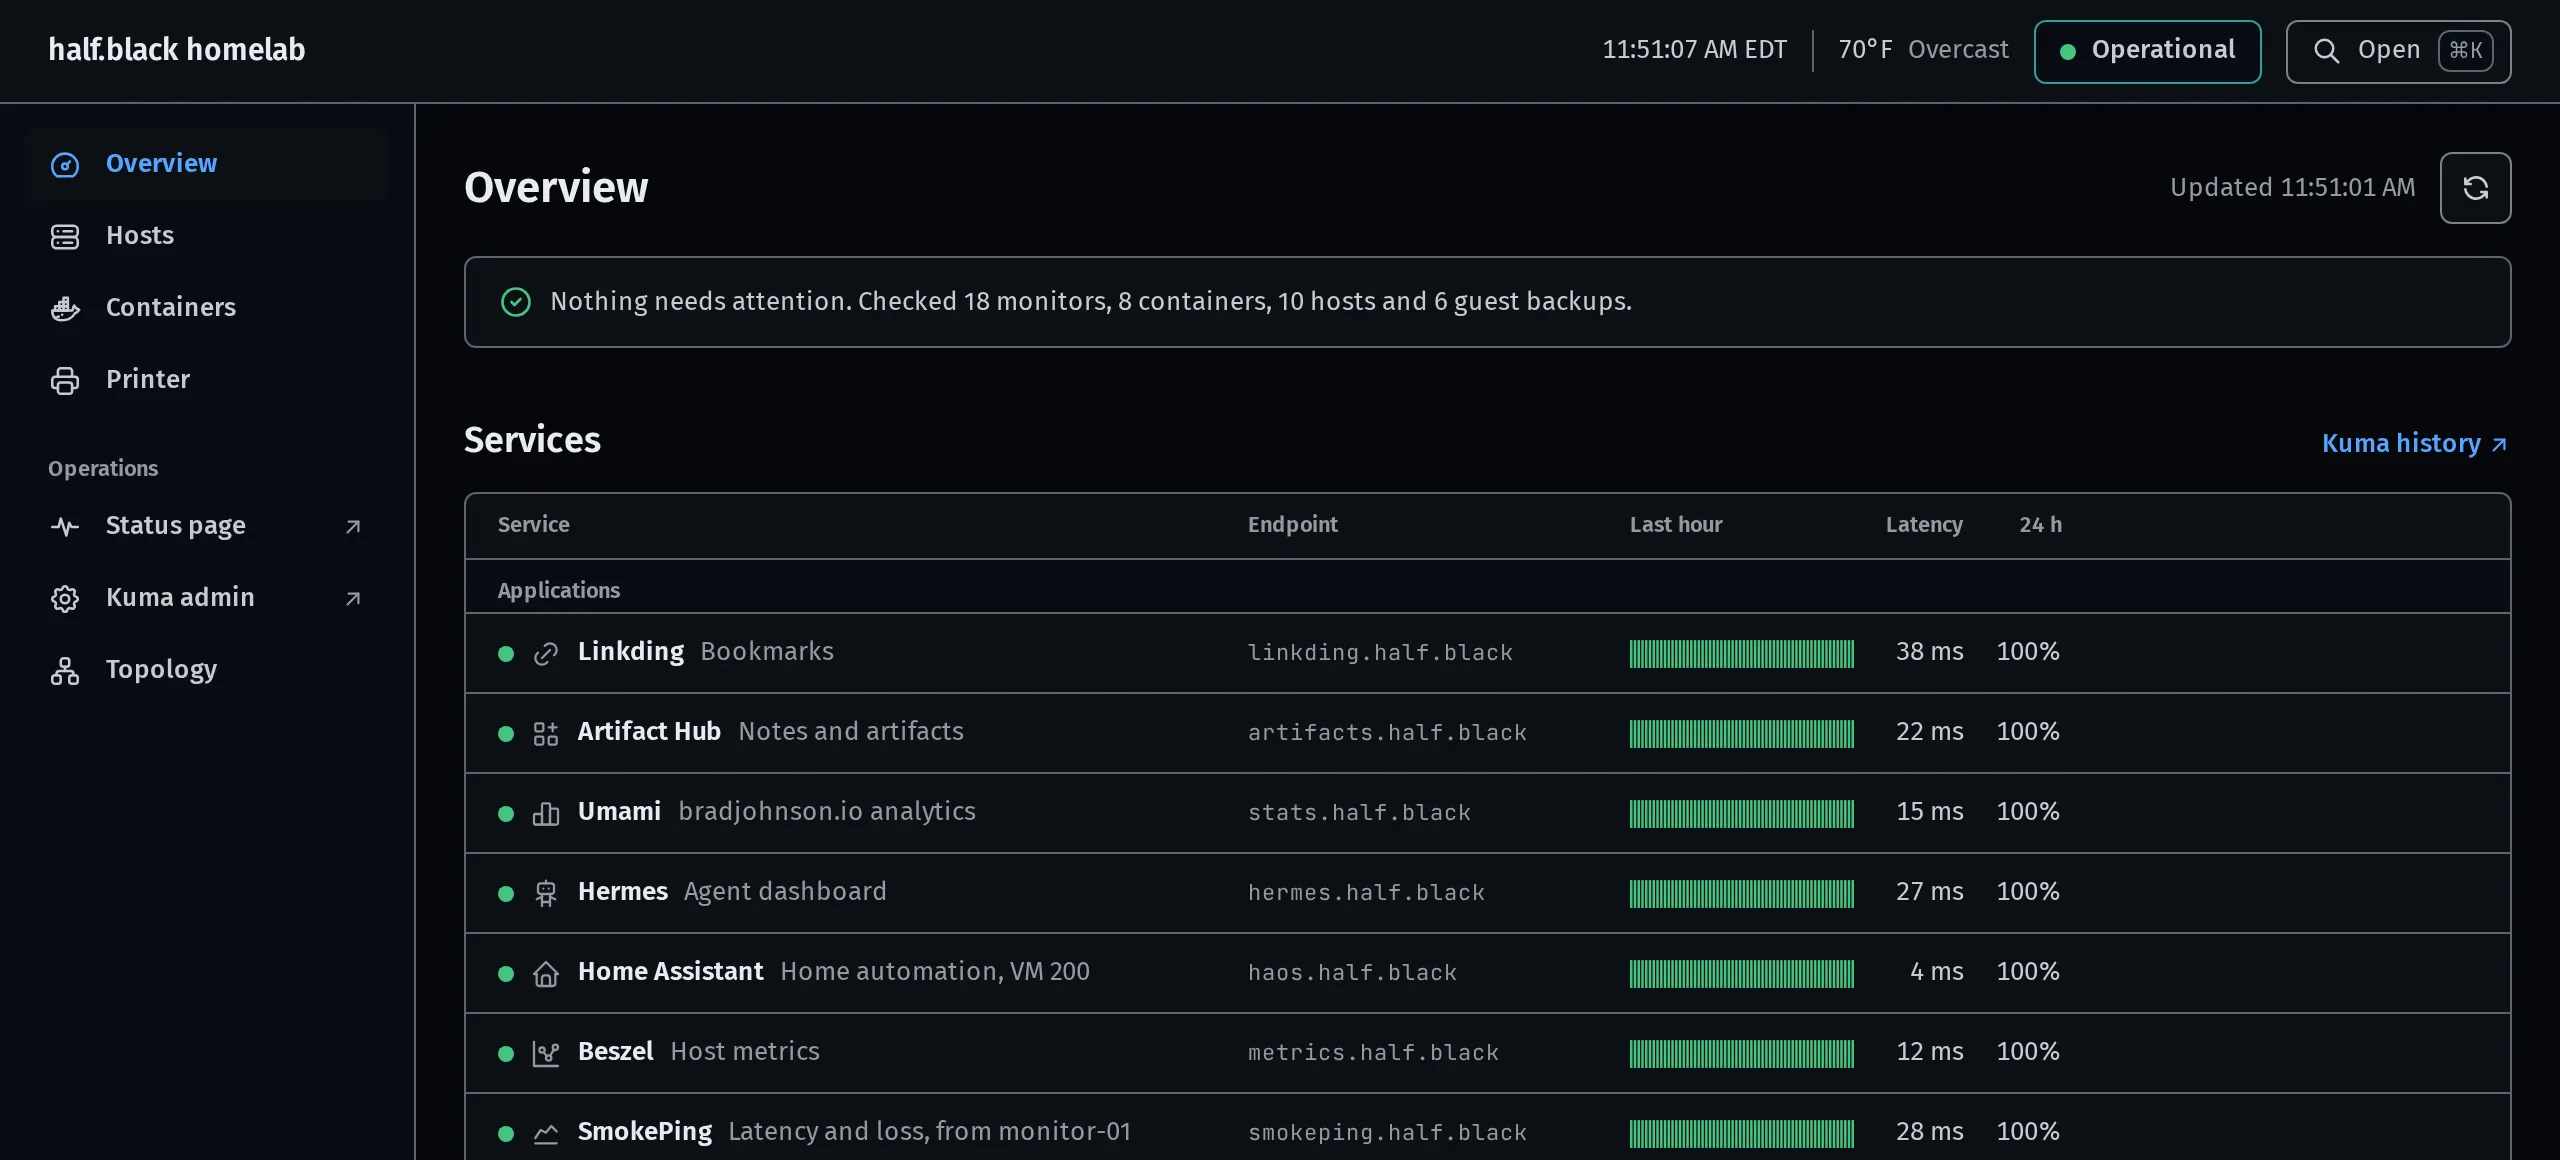
When something does, it becomes a list, most severe first. The rules are plain thresholds: disk warns at 85% and goes critical at 95%, memory warns at 90%, temperature at 80°C. The nightly backup runs at 02:30, so a guest whose newest backup is more than 26 hours old is a warning and 50 hours is critical. A snapshot file that’s gone stale is a warning of its own, with the name of the timer to check. And if hosts.yaml says a host runs a Beszel agent but Beszel has never heard of it, that shows up too. The inventory knows what should be there, so the dashboard can tell me what’s missing.
The outage that moved my monitoring
On September 29, think-1’s onboard Intel NIC stopped transmitting from 11:17 to 15:45. The kernel logged Detected Hardware Unit Hang 8,044 times, and every guest on that node was off the network until the node was power-cycled. It had done the same thing on August 28, with 33,451 hang messages.
The fix for the NIC is a known workaround for the e1000e driver: turn off TCP and generic segmentation offload.
iface nic0 inet manual
	post-up /usr/sbin/ethtool -K nic0 tso off gso off
The bigger problem was that Uptime Kuma and the Beszel hub both ran on VMs on think-1. When think-1 lost its network, Kuma couldn’t tell me about it, because Kuma was on the same box.
The day after, think-1 and the ingress VM started pinging healthchecks.io once a minute. If the pings stop for three minutes, healthchecks.io sends an alert through ntfy to my phone. Something outside the house has to notice when the house goes quiet. The same round of fixes added nightly backups of the think-1 VMs to the NAS, a firewall on the Docker hosts and log rotation, all written up in the repo.
On October 11 I moved Kuma and Beszel to a new VM, monitor-01, on think-2, so a think-1 outage now shows up as failed monitors. monitor-01 got its own heartbeat, which covers the case where think-2 is the one that dies.
Deploys
scripts/deploy-dashboard.sh builds locally, rsyncs to a staging directory on the ingress VM, links in the snapshot files, then swaps the new release into place and keeps the previous one next to it. If a deploy is bad, rolling back is one mv.
A recent addition is a Chrome new tab page at /newtab.html with a tile for every site in the Caddyfile, Billerica weather, the moon phase and my bookmarks. It reads the Caddyfile too, so a new service shows up there the day I add its route.